Representational Similarity Analysis- A great method for linking ERPs to computational models, fMRI data, and more

Representational similarity analysis (RSA) is a powerful multivariate pattern analysis method that is widely used in fMRI, and my lab has recently published two papers applying RSA to ERPs. We’re not the first researchers to apply RSA to ERP or MEG data (see, e.g., Cichy & Pantazis, 2017; Greene & Hansen, 2018). However, RSA is a relatively new approach with amazing potential, and I hope this blog inspires more people to apply RSA to ERP data. You can also watch a 7-minute video overview of RSA on YouTube. Here are the new papers:

  • Kiat, J.E., Hayes, T.R., Henderson, J.M., Luck, S.J. (in press). Rapid extraction of the spatial distribution of physical saliency and semantic informativeness from natural scenes in the human brain. The Journal of Neuroscience. https://doi.org/10.1523/JNEUROSCI.0602-21.2021 [preprint] [code and data]

  • He, T., Kiat, J. E., Boudewyn, M. A., Segae, K., & Luck, S. J. (in press). Neural Correlates of Word Representation Vectors in Natural Language Processing Models: Evidence from Representational Similarity Analysis of Event-Related Brain Potentials. Psychophysiology. https://doi.org/10.1111/psyp.13976 [preprint] [code and data]

Examples

Before describing how RSA works, I want to whet your appetite by showing some of our recent results. Figure 1A shows results from a study that examined the relationship between scalp ERP data and a computational model that predicts the saliency of each location in a natural scene. 50 different scenes were used in the experiment, and the waveform in Figure 1A shows the representational link between the ERP data and the computational model at each moment in time. You can see that the link onsets rapidly and peaks before 100 ms, which makes sense given that the model is designed to reflect early visual cortex. Interestingly, the link persists well past 300 ms. Our study also examined meaning maps, which quantify the amount of meaningful information at each point in a scene. We found that the link between the ERPs and the meaning maps began only slightly after the link with the saliency model. You can read more about this study here.
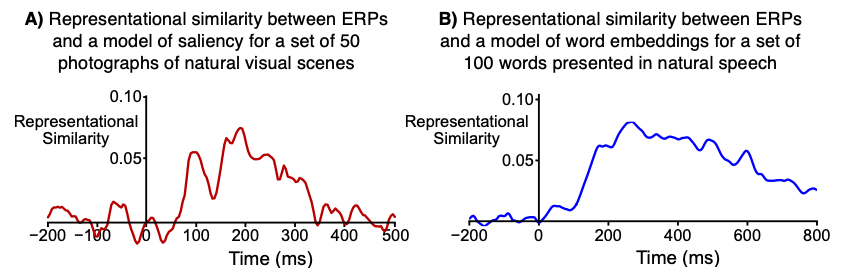
FIGURE 1

Figure 1B shows some of the data from our new study of natural language processing, in which subjects simply listened to stories while the EEG was recorded. The waveform shows the representational link between scalp ERP data and a natural language processing model for a set of 100 different words. You can see that the link starts well before 200 ms and lasts for several hundred milliseconds. The study also examined a different computational model, and it contains many additional interesting analyses.

In these examples, RSA allows us to see how brain activity elicited by complex, natural stimuli can be related to computational models, using brain activity measured with the high temporal resolution and low cost of scalp ERP data. This technique is having a huge impact on the kinds of questions my lab is now asking. Specifically :

  • RSA is helping us move from simple, artificial laboratory stimuli to stimuli that more closely match the real world.

  • RSA is helping us move from qualitative differences between experimental conditions to quantitative links to computational models.

  • RSA is helping us link ERPs with the precise neuroanatomy of fMRI and with rich behavioral datasets (e.g., eye tracking).

Figure 1 shows only a small slice of the results from our new studies, but I hope they give you the idea of the kinds of things that are possible with RSA. We’ve also made the code and data available for both the language study (https://osf.io/zft6e/) and the visual attention study (https://osf.io/zg7ue/). Some coding is skill is necessary to implement RSA, but it’s easier than you might think (especially when you use our code and code provided by other labs as a starting point).

Now let’s take a look at how RSA works in general and how it is applied to ERP data.

The Essence of Representational Similarity Analysis (RSA)

RSA is a general-purpose method for assessing links among different kinds of neural measures, computational models, and behavior. Each of these sources of data has a different format, which makes them difficult to compare directly. As illustrated in Figure 2, ERP datasets contain a voltage value at each of several scalp electrode sites at each of several time points; a computational model might contain an activation value for each of several processing units; a behavioral dataset might consist of a set of eye movement locations; and an fMRI dataset might consist of a set of BOLD beta values in each voxel within a given brain area. How can we link these different types of data to each other? The mapping might be complex and nonlinear, and there might be thousands of individual variables within a dataset, which would limit the applicability of traditional approaches to examining correlations between datasets.

RSA takes a very different approach. Instead of directly examining correlations between datasets, RSA converts each data source into a more abstract but directly comparable format called a representational similarity matrix (RSM). To obtain an RSM, you take a large set of stimuli and use these stimuli as the inputs to multiple different data-generating systems. For example, the studies shown in Figure 1 involved taking a set of 50 visual scenes or 100 spoken words and presenting them as the input to a set of human subjects in an ERP experiment and as the input to a computational model.

As illustrated in Figure 2A, each of the N stimuli gives you a set of ERP waveforms. For each pair of the N stimuli, you can quantify the similarity of the ERPs (e.g., the correlation between the scalp distributions at given time point), leading to an N x N representational similarity matrix.

FIGURE 2

The same N stimuli would also be used as the inputs to the computational model. For each pair of stimuli, you can quantify the similarity of model’s response to the two stimuli (e.g., the correlation between the pattern of activation produced by the two stimuli). This gives you an N x N representational similarity matrix for the model.

Now we’ve transformed both the ERP data and the model results into N x N representational similarity matrices. The ERP data and the model originally had completely different units of measurement and data structures that were difficult to relate to each other, but now we have the same data format for both the ERPs and the model. This makes it simple to ask how well the similarity matrix for the ERP data matches the similarity matrix for the model. Specifically, we can just calculate the correlation between the two matrices (typically using a rank order approach so that we only assume a monotonic relationship, not a linear relationship).

Some Details

The data shown in Figure 1 used the Pearson r correlation coefficient to quantify the similarity between ERP scalp distributions. We have found that this is a good metric of similarity for ERPs, but other metrics can sometimes be advantagous. Note that many researchers prefer to quantify dissimilarity (distance) rather than similarity, but the principle is the same.

Each representational similarity matrix (RSM) captures the representational geometry of the system that produced the data (e.g., the human brain or the computational model). The lower and upper triangles of the RSM as described in this approach are mirror images of each other and are redundant. Similarly, cells along the diagonal index the similarity of each item to itself and are not considered in cross-RSM comparisons. We therefore use only the lower triangles of the RSMs. As illustrated in Figure 2a, the representational similarity between the ERP data and the computational model is simply the (rank order) correlation between the values in these two lower triangles.

When RSA is used with ERP data, representational similarity is typically calculated separately for each time point. That is, the scalp distribution is obtained at a given time point for each of the N stimuli, and the correlation between the scalp distributions for each pair of stimuli is computed at this time point. Thus, we have an N x N RSM at each time point for the ERP data. Each of these RSMs is then correlated with the RSM from the computational model. If the model has multiple layers, this process is conducted separately for each layer.

For example, the waveforms shown in Figure 1 show the (rank order) correlation between the ERP RSM at a given time point and the model RSM. That is, each time point in the waveform shows the correlation between the ERP RSM for that time point and the model RSM.

ERP scalp distributions can vary widely across people, so RSA is conducted separately for each participant. That is, we compute an ERP RSM for each participant (at each time point) and calculate the correlation between that RSM and the Model RSM. This gives us a separate ERP-Model correlation value for each participant at each time point. The waveforms shown in Figure 1 show the average of the single-participant correlations.

The correlation values in RSA studies of ERPs are typically quite low compared to the correlation values you might see in other contexts (e.g., the correlation between P3 latency and response time). For example, all of the correlation values in the waveforms shown in Figure 1 are less than 0.10. However, this is not usually a problem for the following reasons:

  • The low correlations are mainly a result of the noisiness of scalp ERP data when you compute a separate ERP for each of 50-100 stimuli, not a weak link between the brain and the model.

  • It is possible to calculate a “noise ceiling,” which represents the highest correlation between RSMs that could be expected given the noise in the data. The waveforms shown in Figure 1 reach a reasonably high value relative to the noise ceiling.

  • When the correlation between the ERP RSM and the model RSM is computed for a given participant, the number of data points contributing to the correlation is typically huge. For a 50 x 50 RSM (as in Figure 1A), there are 1225 cells in the lower triangle. 1225 values from the ERP RSM are being correlated with 1225 values from the model RSM. This leads to very robust correlation estimates.

  • Additional power is achieved from the fact that a separate correlation is computed for each participant.

  • In practice, the small correlation values obtained in ERP RSA studies are scientifically meaningful and can have substantial statistical power.

RSA is usually applied to averaged ERP waveforms, not single-trial data. For example, we used averages of 32 trials per image in the experiment shown in Figure 1A. The data shown in Figure 1B are from averages of at least 10 trials per word. Single-trial analyses are possible but are much noisier. For example, we conducted single-trial analyses of the words and found statistically significant but much weaker representational similarity.

Other Types of Data

As illustrated in Figure 2A, RSA can also be used to link ERPs to other types of data, including behavioral data and fMRI data.

The behavioral example in Figure 2A involves eye tracking. If the eyes are tracked while participants view scenes, a fixation density map can be constructed showing the likelihood that each location was fixated for each scene. An RSM for the eye-tracking data could be constructed to indicate the similarity between fixation density maps for each pair of scenes. This RSM could then be correlated with the ERP RSM at each time point. Or the fixation density RSMs could be correlated with the RSM for a computational model (as in a recent study in which we examined the relationship between infant eye movement patterns and a convolutional neural network model of the visual system; Kiat et al., 2022).

Other types of behavioral data could also be used. For example, if participants made a button-press response to each stimulus, one could use the mean response times for each stimulus to construct an RSM. The similarity value for a given cell would be the difference in mean RT between two different stimuli.

RSA can also be used to link ERP data to fMRI data, a process called data fusion (see, e.g., Mohsenzadeh et al., 2019). The data fusion process makes it possible to combine the spatial resolution of fMRI with the temporal resolution of ERPs. It can yield a millisecond-by-millisecond estimate of activity corresponding to a given brain region, and it can also yield a voxel-by-voxel map of the activity corresponding to a given time point. More details are provided in our YouTube video on RSA.

Pre- and post-conference workshops at virtual SPR meeting

We will be holding both pre- and post-conference workshops at this year’s virtual SPR meeting.

The pre-conference workshop will be a Mini ERP Boot Camp presented by Steve Luck (click here for details). Participants will first complete our free online Introduction to ERPs course. We will then have a series of three 4-hour synchronous online sessions (October 4, 5, and 6). These sessions will include lectures on more advanced topics and plenty of opportunity for interactive Q&A. Attendance requires registering for the SPR meeting and paying an additional workshop fee. Click here for the registration site.

The post-conference workshop will be a webinar on ERP decoding presented by Steve Luck, Gi-Yeul Bae, and Aaron Simmons (click here and scroll down for details). It will be a slightly updated version of the decoding webinars we gave in June. Attendance is free for meeting registrants but requires additional pre-registration. Click here for the registration site.

We will also be presenting a poster on our new metric of ERP data quality (Poster 3-085, Friday, October 9, 2020, 1:30 p.m.-2:30 p.m. EDT).

New resources for teaching about ERPs (especially for remote teaching during the COVID-19 pandemic)

Will you be teaching a course about ERPs (or a broader course with significant ERP content) this year? Will you need to be teaching remotely as a result of the COVID-19 pandemic? Are you concerned that you and your students will suffer from Zoom fatigue if you try to replace all your in-person classes with synchronous Zoom meetings? If so, we have some resources that might help!

We’ve created a free, fully online “Introduction to ERPs” course. It’s designed for people who want to be able to read and evaluate ERP studies or who need to get a basic background prior to learning to conduct ERP research. It can be accessed at https://courses.erpinfo.org/courses/Intro-to-ERPs.

The main goal of this blog post is to let you know that you can use any or all of the individual materials for this course in the courses you teach. These materials should be particularly helpful if you’re teaching remotely during the COVID-19 pandemic (but I think you’ll find them useful even after the pandemic). You can access the materials at https://erpinfo.org/intro-to-erps-course-materials.

All of the course materials have been released with a Creative Commons license so that you can use them in any way you want. You just need to provide an attribution (“by Steven J. Luck, https://erpinfo.org/”).

The course consists primarily of a series of 5-minute lecture videos hosted on YouTube (including closed captioning for ADA compliance). You can preview the videos here: https://www.youtube.com/playlist?list=PLXKXgcv8muTKKSReNVWsOUBiIOvinSIrD

The videos are organized into “chapters,” each of which contains 4-8 videos. You can use any or all of them. If you’re going to use more than a few, we recommend that you keep them in their current order. You can see a table of contents here.

The first five chapters focus on what ERPs are and how they’re used, and the last three chapters focus on the methodological information that students need to learn so that they can read, understand, and critically evaluate ERP papers and/or start working in an ERP lab.

Each lecture video is followed by 1-2 quiz questions (which are very important for keeping the students engaged and maximizing their understanding and retention of the materials). 

Each chapter also includes a PDF with lecture notes for that chapter. 

We can provide you with links to the videos, the lecture notes (in PDF or PowerPoint format), files containing the quiz questions, transcripts of the videos, etc. If you use the Canvas learning management system, we can also provide the materials in a format that you can import with a few keystrokes.

We’ve also provided a special version of the first lecture video designed for undergrad courses at other colleges and universities. If you’d like, we can work with you to provide a custom introductory video to make it seem even more natural that your course includes lecture videos provided by a professor from a different university.

Most of the materials are available for download at https://erpinfo.org/intro-to-erps-course-materials. Some of the course materials (e.g., the quiz questions and answers) are on a password-protected web site so that your students won’t find them. We can give you access to this site.

Questions and requests for materials can be directed to Steve Luck (sjluck@ucdavis.edu). I really want people to take advantage of these materials, so don’t hesitate to contact me!

I’m planning to use these videos myself in an undergraduate-level ERP course that I’ll be developing next year. By having the students watch these lecture videos outside of class, I’ll be able to focus the class meetings on discussing journal articles and on teaching students to analyze ERP data (using the ERP CORE data). The lecture videos are designed to give the students the background knowledge necessary to read and critically evaluate ERP papers. One of the chapters goes through the methods section of an actual ERP paper, explaining every typical step of recording and analysis. And the final chapter goes through 10 common problems in ERP studies so that the students will know what to look for when they’re critically evaluating a paper. Toward the end of the term, I’ll have students find ERP papers on topics that they find interesting and write reviews of them as if they were journal submissions. This is something I’d ordinarily reserve for a grad course, but I’m pretty sure that my UC Davis juniors and seniors will be able to handle this after watching these videos and going through several papers in class.

Webinar on the ERP CORE

Note: This webinar was originally scheduled for August 12, but it has been rescheduled for August 26.

We will be holding a webinar on the ERP CORE, a freely available online resource we developed for the ERP community.

The ERP CORE includes: 1) experiment control scripts for 6 optimized ERP paradigms that collectively elicit 7 ERP components (N170, MMN, N2pc, N400, P3, LRP, and ERN) in just one hour of recording time, 2) raw and processed data from 40 neurotypical young adults in each paradigm, 3) EEG/ERP data processing pipelines and analysis scripts in EEGLAB and ERPLAB Matlab Toolboxes, and 4) a broad set of ERP results and EEG/ERP data quality measures for comparison across laboratories.

Check out this blog post for more information about the ERP CORE and how you can use it.

The webinar will be presented by Emily Kappenman, and it will be held on Wednesday, August 26 at 9:00 AM Pacific Daylight Time (GMT-7). We expect that it will last 60-90 minutes.

During the webinar, we will (a) provide an overview of the ERP CORE paradigms; (b) introduce the data set, analysis files, and Matlab scripts provided in the resource; and (c) describe some ways that you might use the ERP CORE in your research.

Advance registration is required and will be limited to the first 950 registrants. You can register at https://ucdavis.zoom.us/webinar/register/WN_BlozaZr-QeW6htlBqQXtpQ.

When you register, you will immediately receive an email with an individualized Zoom link. If you do not see the email, check your spam folder. If you still don’t see it, you may have entered your email address incorrectly.

If you can’t attend, we will make a recording available for 1 week after the webinar. The link to the recording will be provided at https://erpinfo.org/virtual-boot-camp within 24 hours of the end of the webinar. You do NOT need to register to watch the recording.

Questions can be directed to erpbootcamp@gmail.com.

Webinar on Standardized Measurement Error (a universal measure of ERP data quality)

We will be holding a webinar on our new universal measure of ERP data quality, which call the Standardized Measurement Error (SME). Check out this previous blog post for an overview of the SME and how you can use it.

The webinar will be presented by Steve Luck, and it will be held on Wednesday, August 5 at 8:00 AM Pacific Daylight Time (GMT-7). We expect that it will last 60-90 minutes. The timing is designed to allow the largest number of people to attend (even though it will be pretty early in the morning here in California!).

We will cover the basic logic behind the SME, how it can be used by ERP researchers, and how to calculate it for your own data using ERPLAB Toolbox (v8 and higher).

If you can’t attend, we will make a recording available for 1 week after the webinar. The link to the recording will be provided on the Virtual ERP Boot Camp page within 24 hours of the end of the webinar.

Advance registration is required and will be limited to the first 950 registrants. You can register at https://ucdavis.zoom.us/webinar/register/WN_LYlHHglWT2mkegGQdtr-Gg. You do NOT need to register to watch the recording.

When you register, you will immediately receive an email with an individualized Zoom link. If you do not see the email, check your spam folder. If you still don’t see it, you may have entered your email address incorrectly.

Questions can be directed to erpbootcamp@gmail.com.

Now available: Protocol for reducing COVID-19 transmission risk in EEG research

Simmons, A. M., & Luck, S. J. (2020). Protocol for Reducing COVID-19 Transmission Risk in EEG Research. Protocol Exchange. https://doi.org/10.21203/rs.3.pex-974/v1

The COVID-19 pandemic triggered a pause in data collection for EEG research throughout much of the world. As conditions improve in some regions, many researchers would like to resume data collection. However, because the application of EEG electrodes typically involves close and prolonged exposure between the experimenter and the research participant, there will be some risk of viral infection in EEG experiments until there is an effective and widely used vaccine. It is therefore important to develop effective mitigation methods than can reduce the risks so that they are comparable to the risks that individuals will face in their daily lives (e.g., when visiting the grocery store or getting a haircut).

Toward that end, we created this protocol for reducing COVID-19 transmission risk in EEG research. We created this protocol with feedback from local EEG/ERP researchers, from neurologists who have experience with clinical EEG recordings, and from the worldwide EEG/ERP research community. The protocol is designed for use in relatively simple experimental paradigms with adult participants, but it could be easily adapted for other populations and paradigms. It could also be adapted for use with other recording methods. We assume that each researcher will carefully read the protocol and adapt it to local conditions.

If you use/adapt our protocol, please cite it!

Important: We are not implying that researchers in all locations should resume EEG recordings at this time. Resumption of research will depend on your local conditions and the rules imposed by your institution and your local, regional, and national governing bodies. However, once it is ethical and allowable for you to resume research, we hope that this protocol will help you conduct your research in a way that is safe for both laboratory personnel and research participants.

ERP decoding webinars on June 29 and June 30

Recordings of the webinars are no longer available. However, we are working on a plan to present these webinars again in late summer or early fall. We are also planning webinars on other topics. If you are interested in getting updates about future events, please join our email list.


We will be giving a pair of webinars on ERP decoding that are open to the worldwide ERP community as part of our Virtual ERP Boot Camp.

Part 1 (Monday, June 29, 8:00 AM Pacific Time) will be a general overview of how ERP decoding works, what kinds of things can be decoded, and the strengths and weaknesses of decoding relative to traditional univariate ERP analysis methods. This part will be led by Steve Luck.

Part 2 (Tuesday, June 30, 8:00 AM Pacific Time) will be a how-to workshop led by Gi-Yeul Bae (who developed our decoding approach) and Aaron Simmons (the lab manager for the Luck Lab). They will go through our decoding pipeline line by line so that you’ll be able to easily apply it to your own data. Everything is in Matlab, using a bit of EEGLAB and ERPLAB and a lot of custom code that can be easily adapted for a broad range of experiments. Part 2 will assume that you’ve done Part 1 and that you have at least a little Matlab coding experience.

We expect that each part will be approximately 2 hours (but this is just an estimate). We realize that the timing will not be appropriate for some time zones, but 8:00 AM here in California is about the best we can realistically do.

We will make recordings available on erpinfo.org for one week following each webinar. The links should be available by the end of the day (California time) on July 1.

We will focus on decoding for basic science and preclinical research, not for engineering applications. For example, our methods are not very useful for brain-computer interfaces., but they can be incredibly powerful for answering scientific questions about the human mind and brain. For an overview of our approach and links to recent papers, see this blog post.

Inquiries should be directed to erpbootcamp@gmail.com.

Announcing the Release of ERP CORE: An Open Resource for Human Event-Related Potential Research

We are excited to announce the official release of the ERP CORE, a freely available online resource we developed for the ERP community. The ERP CORE was designed to help everyone from novice to experienced ERP researchers advance their program of research in several distinct ways.

The ERP CORE includes: 1) experiment control scripts for 6 optimized ERP paradigms that collectively elicit 7 ERP components (N170, MMN, N2pc, N400, P3, LRP, and ERN) in just one hour of recording time, 2) raw and processed data from 40 neurotypical young adults in each paradigm, 3) EEG/ERP data processing pipelines and analysis scripts in EEGLAB and ERPLAB Matlab Toolboxes, and 4) a broad set of ERP results and EEG/ERP data quality measures for comparison across laboratories.

A paper describing the ERP CORE is available here, and the online resource files are accessible here. Below we detail just some of the ways in which ERP CORE may be useful to ERP researchers.

  • The ERP CORE provides a comprehensive introduction to the analysis of ERP data, including all processing steps, parameters, and the order of operations used in ERP data analysis. As a result, this resource can be used by novice ERP researchers to learn how to analyze ERP data, or by researchers of all levels who wish to learn ERP data analysis using the open source EEGLAB and ERPLAB Matlab Toolboxes. More advanced researchers can use the annotated Matlab scripts as a starting point for scripting their own analyses. Our analysis parameters, such as time windows and electrode sites for measurement, could also be used as a priori parameters in future studies, reducing researcher degrees of freedom.

  • With data for 7 ERP components in 40 neurotypical research participants, the provided ERP CORE data set could be reanalyzed by other researchers to test new hypotheses or analytic techniques, or to compare the effectiveness of different data processing procedures across multiple ERP components. This may be particularly useful to researchers right now, given the limitations many of us are facing in collecting new data sets.

  • The experiment control scripts for each of the ERP CORE paradigms we designed are provided in Presentation software for use by other researchers. Each paradigm was specifically designed to robustly elicit a specific ERP component in a brief (~10 min) recording. The experiment control scripts were programmed to make it incredibly easy for other researchers to directly use the tasks in their laboratories. For example, the stimuli can be automatically scaled to the same sizes as in our original recording by simply inputting the height, width, and viewing distance of the monitor you wish to use to collect data in your lab. The experiment control scripts are also easy to modify using the parameters feature in Presentation, which allows changes to be made to many features of the task (e.g., number of trials, stimulus duration) without modifying the code. Thus, the ERP CORE paradigms could be added on to an existing study, or be used as a starting point for the development of new paradigms.

  • We provide several metrics quantifying the noise levels of our EEG/ERP data that may be useful as a comparison for both novice and experienced ERP researchers to evaluate their laboratory set-up and data collection procedures. The quality of EEG/ERP data plays a big role in statistical power; however, it can be difficult to determine the overall quality of ERP data in published papers. This makes it difficult for a given researcher to know whether their data quality is comparable to that of other labs. The ERP CORE provides measures of data quality for our data, as well as analysis scripts and procedures that other researchers can use to calculate these same data quality metrics on their own data.

These are just some of the many ways we anticipate that the ERP CORE will be used by ERP researchers. We are excited to see what other uses you may find for this resource and to hear feedback on the ERP CORE from the ERP community.

Please Comment: Draft of protocol for reducing COVID-19 transmission risk in EEG research

We are no longer taking comments on this draft. Thanks to everyone who provided comments.

The published protocol is now available on Protocol Exchange. Here’s the citation: Simmons, A. M., & Luck, S. J. (2020). Protocol for Reducing COVID-19 Transmission Risk in EEG Research. Protocol Exchange. https://doi.org/10.21203/rs.3.pex-974/v1

The COVID-19 pandemic has caused a pause in data collection for EEG research throughout much of the world. As conditions improve in some regions, many researchers would like to resume data collection. However, because the application of EEG electrodes typically involves close and prolonged exposure between the experimenter and the research participant, there will be some risk of viral infection in EEG experiments until there is an effective and widely used vaccine. It is therefore important to develop effective mitigation methods than can reduce the risks so that they are comparable to the risks that individuals will face in their daily lives (e.g., when visiting the grocery store or getting a haircut).

Toward that end, we have created a draft of a protocol for reducing COVID-19 transmission risk in EEG research. We have already received feedback from both basic scientists and neurologists who have experience with clinical EEG recordings. To further improve and refine this protocol, we are seeking feedback from the worldwide EEG community. Once we have received that feedback, we will create an updated document and make it available freely on Protocol Exchange. Researchers may then adapt this protocol to reflect their local conditions and regulatory environment.

Important: We are not implying that researchers in all locations should resume EEG recordings at this time. Resumption of research will depend on your local conditions and the rules imposed by your institution and your local, regional, and national governing bodies. However, once it is ethical and allowable for you to resume research, we hope that this protocol will help you conduct your research in a way that is safe for both laboratory personnel and research participants.

You can view and download the current version of the protocol here.

You can provide comments by clicking on Comments at the bottom of the page. Please read the entire protocol before posting comments. If you have specialized knowledge or training that is relevant for this protocol (e.g., medical training in infectious disease), please indicate this in your comments. Comments will be most useful is posted by June 5, 2020.

A New Metric for Quantifying ERP Data Quality

UMDQ polls.jpg

I’ve been doing ERP research for over 30 years, and for that entire time I have been looking for a metric of data quality. I’d like to be able to quantify the noise in my data in a variety of different paradigms, and I’d like to be able to determine exactly how a given signal processing operation (e.g., filtering) changes the signal-to-noise ratio of my data. And when I review a manuscript with really noisy-looking data, making me distrust the conclusions of the study, I’d like to be able to make an objective judgment rather than a subjective judgment. Given the results of the Twitter polls shown here, a lot of other people would also like to have a good metric of data quality.

I’ve looked around for such a metric for many years, but I never found one. So a few years ago, I decided that I should try to create one. I enlisted the aid of Andrew Stewart, Aaron Simmons, and Mijke Rhemtulla, and together we’ve developed a very simple but powerful and flexible metric of data quality that we call the Standardized Measurement Error or SME.

The SME has 3 key properties:

  1. It reflects the extent to which noise (i.e., trial-to-trial variations in the EEG recording) impacts the score that you are actually using as the dependent variable in your study (e.g., the peak latency of the P3 wave). This is important, because the effect of noise will differ across different amplitude and latency measures. For example, high-frequency noise will have a big impact on the peak amplitude between 300 and 500 ms but relatively little impact on the mean voltage during this time range. The impact of noise depends on both the nature of the noise and what you are trying to measure.

  2. It quantifies the data quality for each individual participant at each electrode site of interest, making it possible to determine (for example) whether a given participant’s data are so noisy that the participant should be excluded from the statistical analyses or whether a given electrode should be interpolated.

  3. It can be aggregated across participants in a way that allows you to estimate the impact of the noise on your effect sizes and statistical power and to estimate how your effect sizes and power would change if you increased or decreased the number of trials per participant.

The SME is a very simple metric: It’s just the standard error of measurement of the score of interest (e.g., the standard error of measurement for the peak latency value between 300 and 500 ms). It is designed to answer the question: If I repeated this experiment over and over again in the same participant (assuming no learning, fatigue, etc.), and I obtained the score of interest in each repetition, how similar would the scores be across repetitions? For example, if you repeated an experiment 10,000 times in a given participant, and you measured P3 peak latency for each of the 10,000 repetitions, you could quantify the consistency of the P3 peak latency scores by computing the standard deviation (SD) of the 10,000 scores. The SME metric provides a way of estimating this SD using the data you obtained in a single experiment with this participant.

The SME can be estimated for any ERP amplitude or latency score that is obtained from an averaged ERP waveform. If you quantify amplitude as the mean voltage across some time window (e.g., 300-500 ms for the P3 wave), the SME is trivial to estimate. If you want to quantify peak amplitude or peak latency, you can still use the SME, but it requires a somewhat more complicated estimation technique called bootstrapping. Bootstrapping is incredibly flexible, and it allows you to estimate the SME for very complex scores, such as the onset latency of the N2pc component in a contralateral-minus-ipsilateral difference wave.

Should you start using the SME to quantify data quality in your own research? Yes!!! Here are some things you could do if you had SME values:

  • Determine whether your data quality has increased or decreased when you modify a data analysis step or experimental design feature

  • Notice technical problems that are reducing your data quality (e.g., degraded electrodes, a poorly trained research assistant) 

  • Determine whether a given participant’s data are too noisy to be included in the analyses or whether a channel is so noisy that it should be replaced with interpolated values

  • Compare different EEG recording systems, different recording procedures, and different analysis pipelines to see which one yields the best data quality

The SME would be even more valuable if researchers started regularly including SME values in their publications. This would allow readers/reviewers to objectively assess whether the results are beautifully clean, unacceptably noisy, or somewhere in between. Also, if every ERP paper reported the SME, we could easily compare data quality across studies, and the field could determine which recording and analysis procedures produce the cleanest data. This would ultimately increase the number of true, replicable findings and decrease the number of false, unreplicable findings. 

My dream is that, 10 years from now, every new ERP manuscript I review and every new ERP paper I read will contain SME values (or perhaps some newer, better measure of data quality that someone else will be inspired to develop).

To help make that dream come true, we’re doing everything we can to make it easy for people to compute SME values. We’ve just released a new version of ERPLAB Toolbox (v8.0) that will automatically compute the SME using default time windows every time you make an averaged ERP waveform. These SME values will be most appropriate when you are scoring the amplitude of an ERP component as the mean voltage during some time window (e.g., 300-500 ms for the P3 wave), but they also give you an overall sense of your data quality.  If you are using some other method to score your amplitudes or latencies (e.g., peak latency), you will need to write a simple Matlab script that uses bootstrapping to estimate the SME. However, we have provided several example scripts, and anyone who knows at least a little bit about Matlab scripting should be able to adapt our scripts for their own data. And we hope to add an automated method for bootstrapping in future versions of ERPLAB.

By now, I’m sure you’ve decided you want to give it a try, and you’re wondering where you can get more information.  Here are links to some useful resources: