On the application of decoding/classification/MVPA approaches to ERP data

If you pay any attention to the fMRI literature, you know that there has been a huge increase in the number of studies applying multivariate methods to the pattern of voxels (as opposed to univariate methods that examine the average activity over a set of voxels). For example, if you ask whether the pattern of activity across the voxels within a given region is different for faces versus objects, you’ll find that many areas carry information about whether a stimulus is a face or an object even if the overall activity level is no different for faces versus objects. This class of methods goes by several different names, including multivariate pattern analysis (MVPA), classification, and decoding. I will use the term decoding here, but I am treating these terms as if they are equivalent.

Gi-Yeul Bae and I have recently started applying decoding methods to sustained ERPs and to EEG oscillations (see this paper and this more recent paper), and others have also used them (especially in the brain-computer interface [BCI] field). We have found that decoding can pick up on incredibly subtle signals that would be missed by conventional methods, and I believe that decoding methods have the potential to open up new areas of ERP research, allowing us to answer questions that would ordinarily seem impossible (just as has happened in the fMRI literature). The goal of this blog post is to provide a brief introduction so that you can more easily read papers using these methods and can apply them to your own research.

There are many ways to apply decoding to EEG/ERP data, and I will focus on the approach that we have been using to study perception, attention, and working memory. Our goal in using decoding methods is to determine what information about a stimulus is represented in the brain at a given moment in time, and we apply decoding to averaged ERP waveforms to minimize noise and maximize our ability to detect subtle neural signals. This is very different from the BCI literature, where the goal is to reliably detect signals on single trials that can be used to control devices in real time.

To explain our approach, I will give a simple but hypothetical example. Our actual research examines much more complex situations, so this hypothetical example will be clearer. In this hypothetical study, we present subjects with a sequence 180 face photographs and 180 car photographs, asking them to simply press a single button for each stimulus. A conventional analysis will yield a larger N170 component for the faces than for the cars, especially over lateral occipitotemporal cortex.

Our decoding approach asks, for each individual subject, whether we can reliably predict whether the stimuli that generated a given ERP waveform were faces or cars. To do this, we will take the 180 face trials and the 180 car trials for a given subject and randomly divide them into 3 sets of 60 trials. This will give us 3 averaged face ERP waveforms and 3 averaged car ERP waveforms. We will then take 2 of the face waveforms and two of the car waveforms and feed them into a support vector machine (SVM), which is a powerful machine learning algorithm. The SVM “learns” how the face and car ERPs differ. We do this separately at each time point, feeding the SVM for that time point the voltage from each electrode site at that time point. In other words, the SVM learns how the scalp distribution for the face ERP differs from the scalp distribution for the car ERP at that time point (for a single subject). We then take the scalp distribution at this point in time from the 1 face ERP and the 1 car ERP that were not used to train the SVM, and we ask whether the SVM can correctly guess whether each of these scalp distributions is from a face ERP or a house ERP. We then repeat this process over and over many times using different subsets of trials to create the averaged ERPs used for training and for testing. We can then ask whether, over these many iterations, the SVM can guess whether the test ERP is from faces or cars above chance (50% correct).

This process is applied separately for each time point and separately for each subject, giving us a classification accuracy value for each subject at each time point (see figure below, which shows imaginary data from this hypothetical experiment). We then aggregate across subjects, yielding a waveform showing average classification accuracy at each time point, and we use the mass univariate approach to find clusters of time points at which the accuracy is significantly greater than chance.

Decoding Example.jpg

In some sense, the decoding approach is the mirror image of the conventional approach. Instead of asking whether the face and car waveforms are significantly different at a given point in time, we are asking whether we can predict whether the waveforms come from faces or cars at a given point in time significantly better than chance. However, there are some very important practical differences between the decoding approach and the conventional approach. First, and most important, the decoding is applied separately to each subject, and we aggregate across subjects only after computing %correct. As a result, the decoding approach picks up on the differences between faces and cars at whatever electrode sites show a difference in a particular subject. By contrast, the conventional approach can find differences between faces and cars only to the extent that subjects have similar effects. Given that there are often enormous differences among subjects, the single-subject decoding approach can give us much greater power to detect subtle effects. A second difference is that the SVM effectively “figures out” the pattern of scalp differences that most optimally differentiates between faces and cars. That is, it uses the entire scalp distribution in a very intelligent way. This can also give us greater power to detect subtle effects.

In our research so far, we have been able to detect very subtle effects that never would have been statistically significant in conventional analyses. For example, we can determine which of 16 orientations is being held in working memory at a given point in time (see this paper), and we can determine which of 16 directions of motion is currently being perceived (see this paper). We can even decode the orientation that was presented on the previous trial, even though it’s no longer task relevant (see here). We have currently-unpublished data showing that we can decode face identity and facial expression, the valence and arousal of emotional scenes from the IAPS database, and letters of the alphabet (even when presented at 10 per second).

You can also use decoding to study between-group differences. Some research uses decoding to try to predict which group an individual belongs to (e.g., a patient group or a control group). This can be useful for diagnosis, but it doesn’t usually provide much insight into how the brain activity differs between groups. Our approach has been to use decoding to ask about the nature of the neural representations within each group. But this can be tricky, because decoding is highly sensitive to the signal-to-noise ratio, which may differ between groups for “uninteresting” reasons (e.g., more movement artifacts in one group). We have addressed these issues in this study that compares decoding accuracy in people with schizophrenia and matched control subjects.

ERP Boot Camp Tip: Why mean amplitude is usually superior to peak amplitude

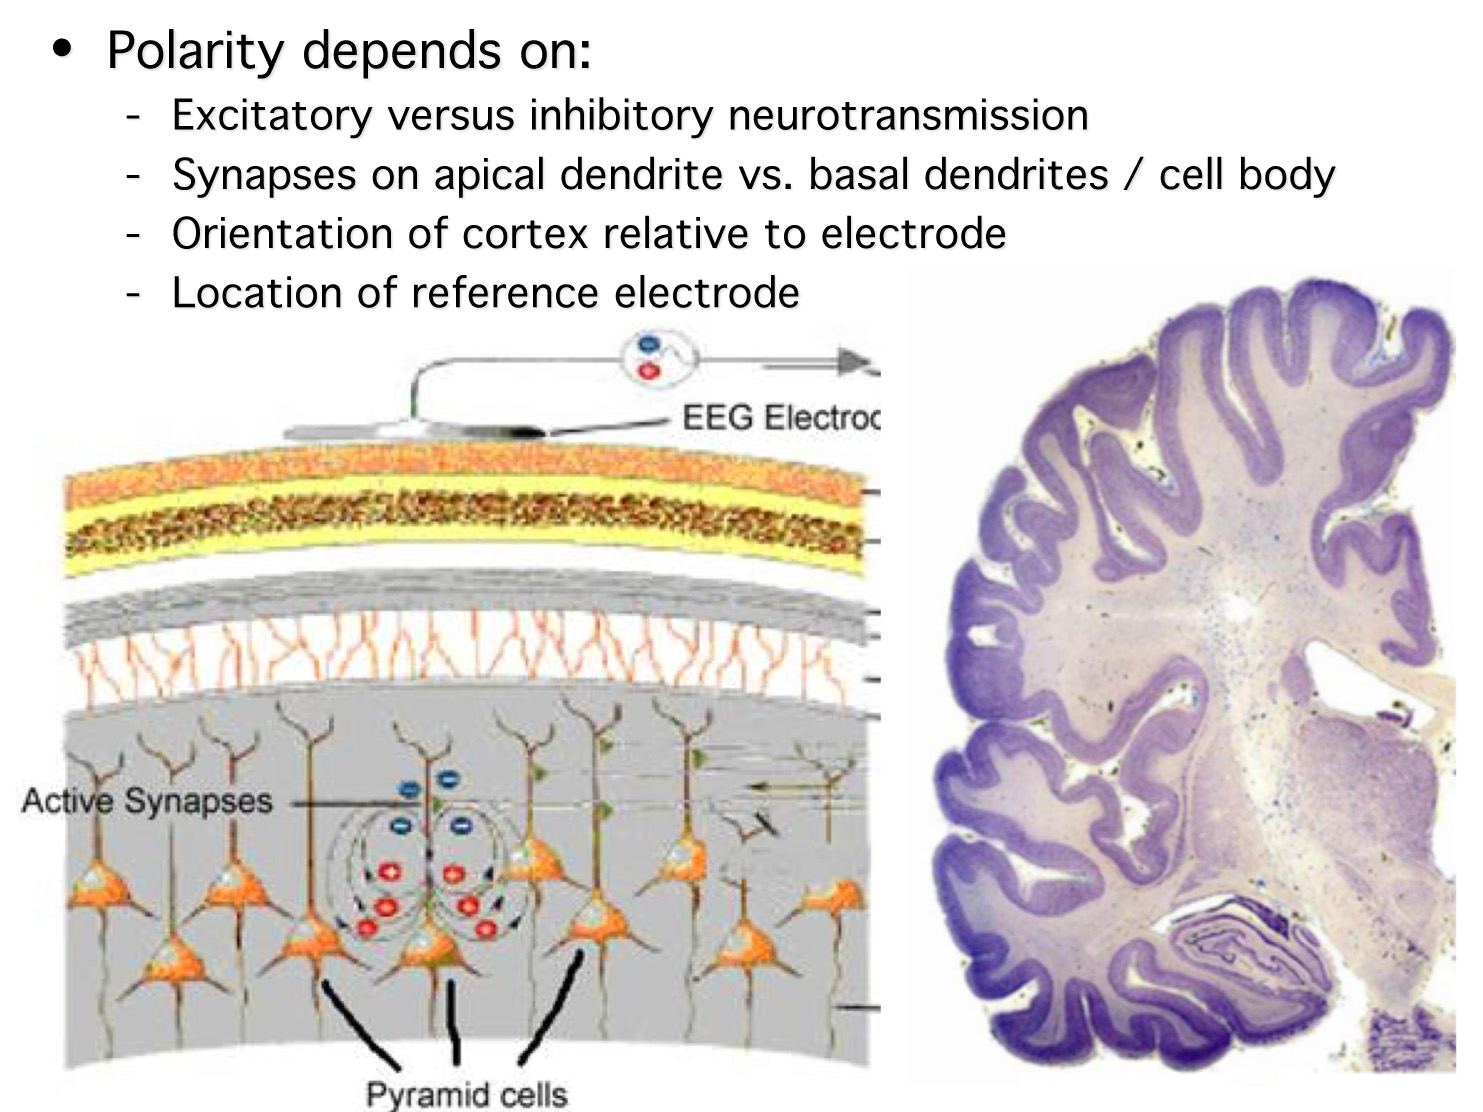
Traditionally, ERP amplitudes were quantified (scored) by finding the maximum voltage (or minimum voltage for a negative component) within some time period.  Why? Mainly because this was easy to do with a ruler and a pencil when your EEG system did not include a general-purpose computer and just gave you a printout of the waveform. When computers became available, and could easily quantify components in more sophisticated ways, many researchers continued to use peaks.

However, other researchers began scoring component amplitudes using the mean voltage within a particular time range. This is still far from perfect, but over time it has become clear that this mean amplitude approach had many advantages over peak amplitude. And there has been a clear shift toward the use of mean amplitude instead of peak amplitude.  However, peak amplitude is still used more than it should be.  The goal of this blog post is to describe some of the reasons why mean amplitude is usually preferable to peak amplitude so that researchers will make an informed choice and not just follow a tradition. A more detailed discussion is provided in Chapter 9 of An Introduction to the Event-Related Potential Technique, 2nd Edition (MIT Press). That chapter also discusses why peak latency is a poor measure of timing and describes some better alternatives.

Reason 1: Peaks and components are not the same thing.  Generally speaking, there's nothing special about the time at which the voltage reaches a maximum amplitude.  Given that multiple components are almost always overlapping at any given moment in time, the time and amplitude of the peak voltage will often not be the same as the time and amplitude of the peak of the component of interest.  Moreover, computational models of cognitive and neural processes rarely have much to say about when a process "peaks."  Instead, they focus on when a process begins, ends, etc.  So, peaks aren't particularly meaningful theoretically, and they can encourage an overly simplistic view of the relationship between the underlying components and the observed waveform.

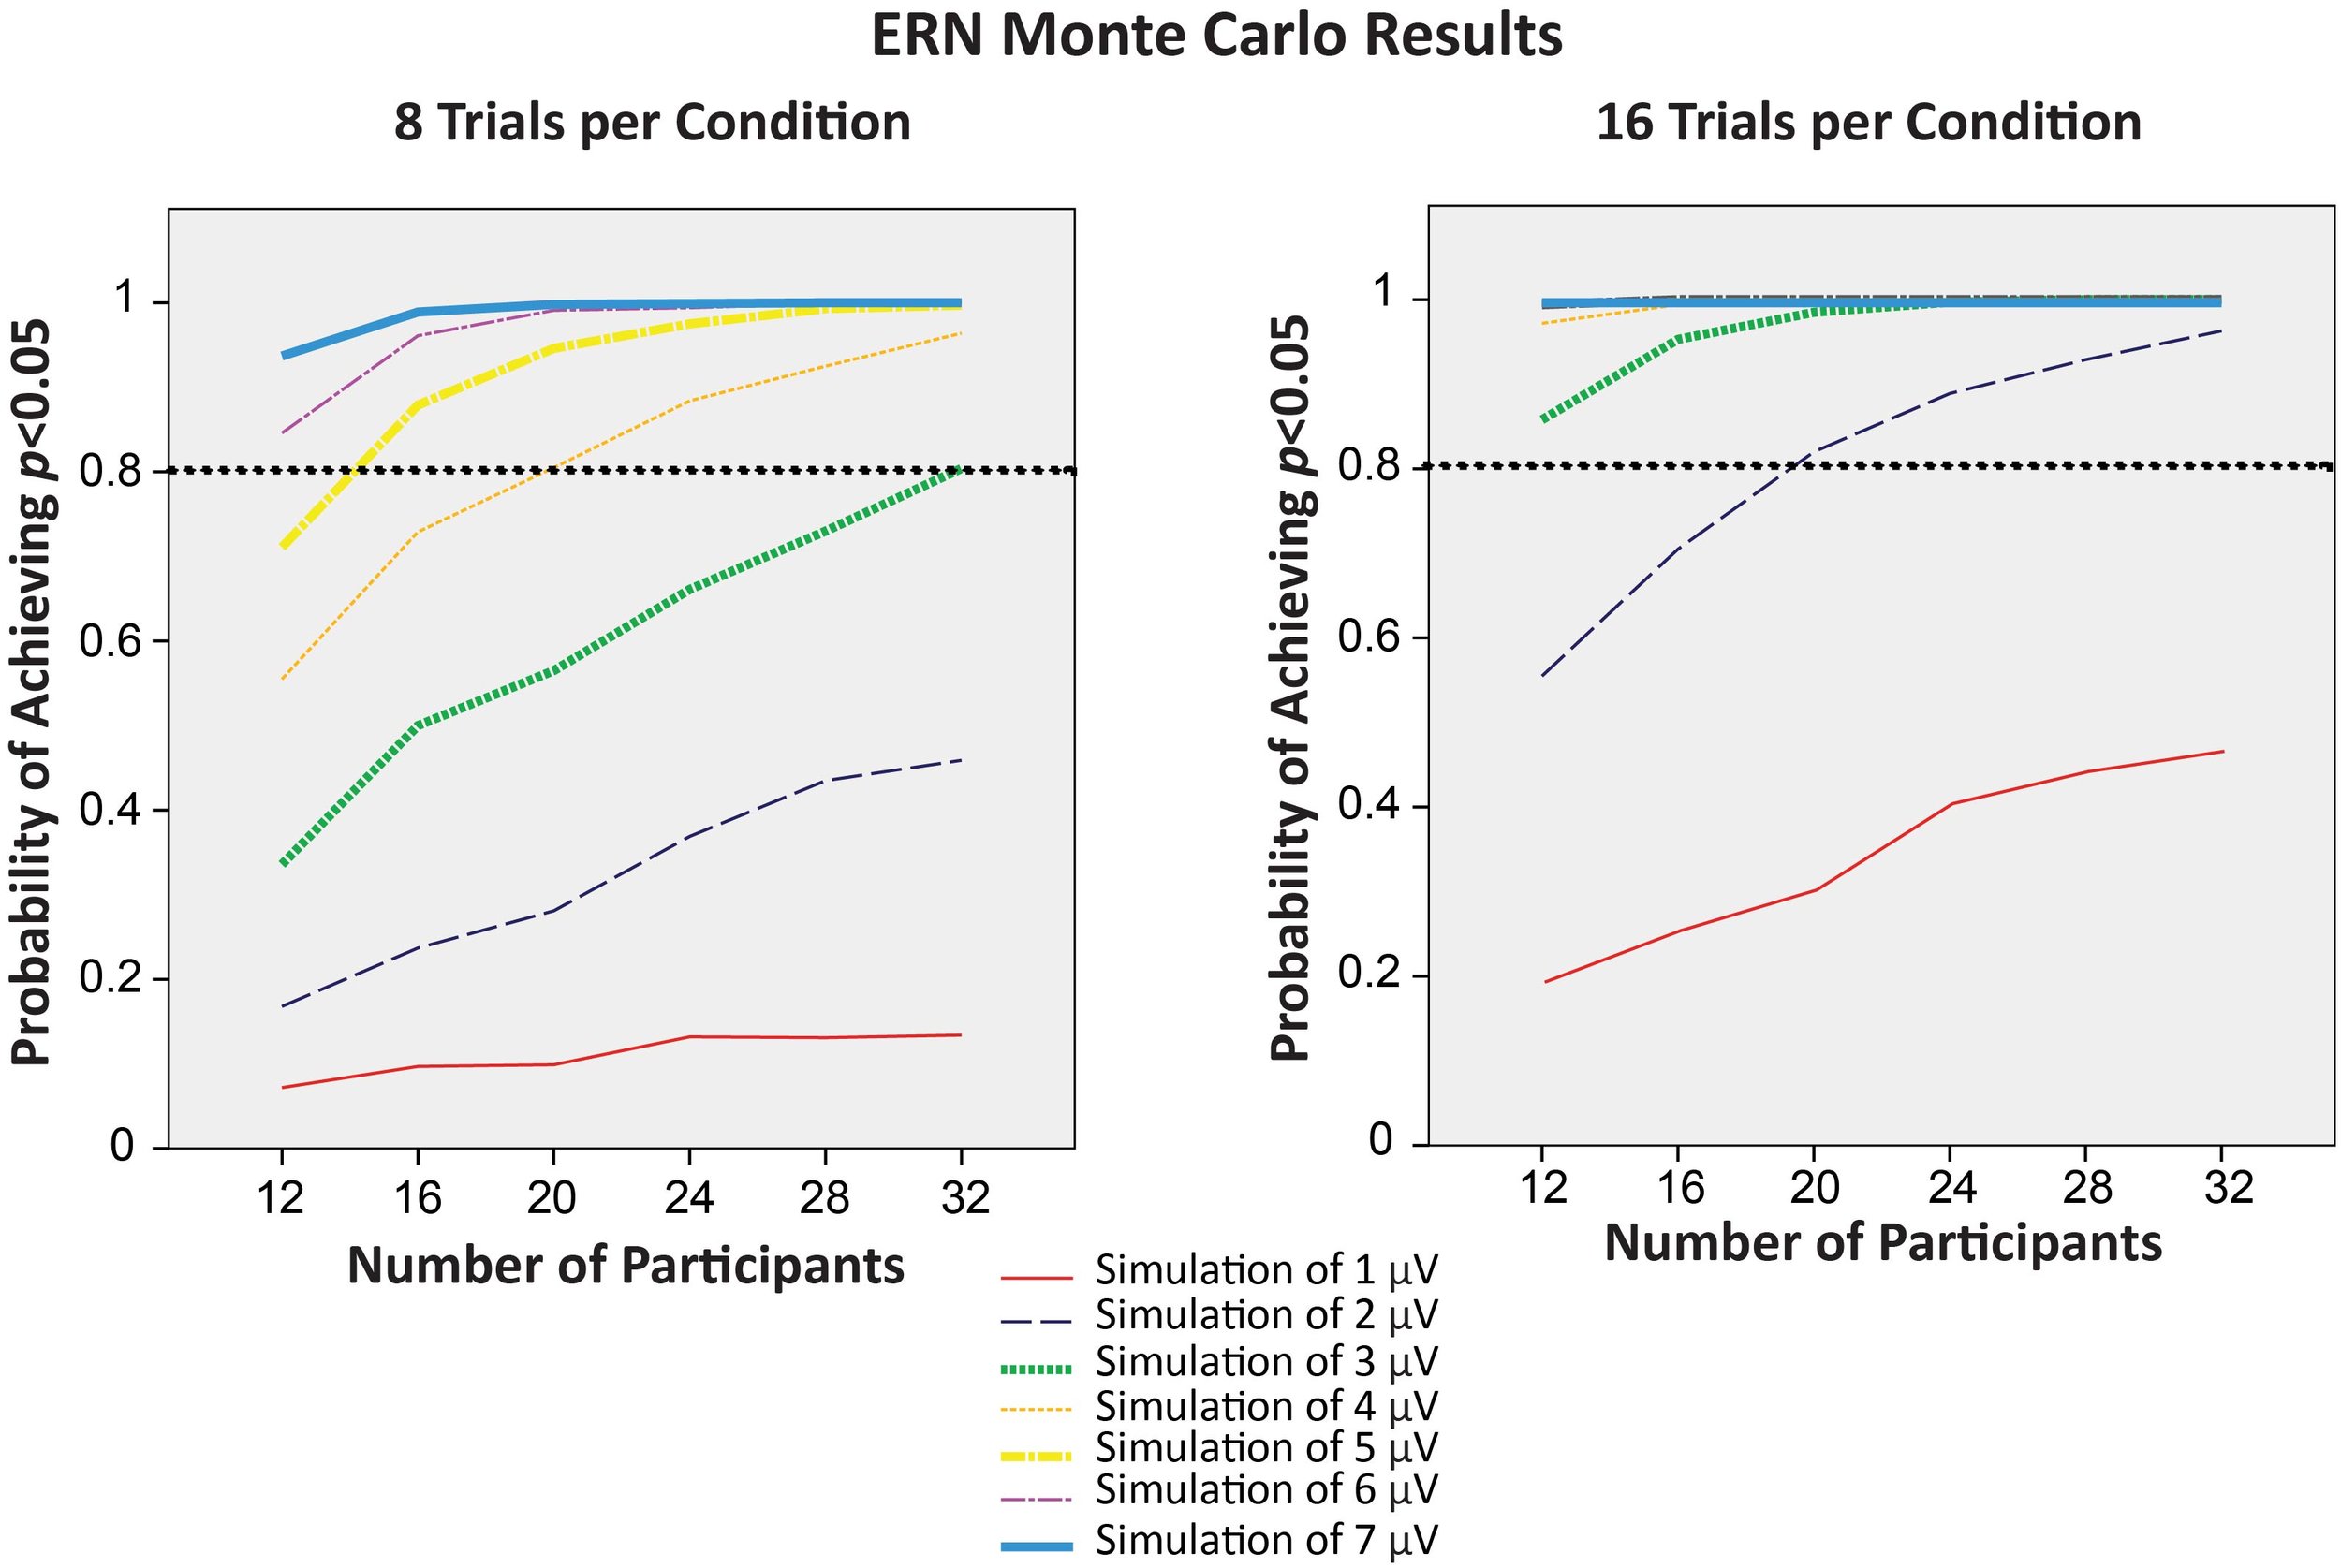
Reason 2: Peak amplitude is typically less reliable than mean amplitude.  Peak amplitude is easily influenced by noise, whereas mean amplitude essentially filters out noise at high and intermediate frequencies. Here's a nice study showing that mean amplitude provides more robust results than peak amplitude: Clayson, P. E., Baldwin, S. A., & Larson, M. J. (2013). How does noise affect amplitude and latency measurement of event-related potentials (ERPs)? A methodological critique and simulation study. Psychophysiology, 50, 174-186.

Reason 3: The peak occurs at different times at different electrode sites.  An ERP component in the brain will have the same timing at every electrode site, but the timing of the peak voltage may differ considerably from site to site (because of other overlapping components). Consequently, when you measure the peak at multiple electrode sites, you're measuring the underlying component at different time points at each site, which is just a weird thing to do. More formally, it's not legitimate to look at the scalp distribution of a peak amplitude measurement (unless you find the peak at one electrode site and then measure all electrode sites at that time point).

Reason 4: Peak amplitude is biased by the noise level and number of trials, but mean amplitude is not.  The noisier the data, the bigger the peak (all else being equal). As a result, it's not legitimate to compare peak amplitudes from groups or conditions that differ in noise level (usually as a result of differences in the number of trials). However, mean amplitude is unbiased (i.e., the variance will increase as the noise level increases, but the score is not pushed to a consistently higher value). If you are measuring mean amplitude, it's perfectly legitimate to compare groups or conditions with different noise levels or different numbers of trials. For more details, see this previous blog post.

Reason 5: Peak is a nonlinear measures whereas mean is linear. Linear operations have many advantages. One is that the order of operations does not matter for linear operations [e.g., (A + B) + C = A + (B + C)]. If you measure the mean amplitude on each individual trial and then average these values together, you get the exactly same thing as if you average the single-trial waveforms together and then measure mean amplitude. Similarly, if you measure the mean amplitude from each subject's averaged ERP waveform and then average these values together, the result will be identical to measuring the mean amplitude from the grand average.  By contrast, you may get a very different value if you measure the peak on the single trials (or single subjects) rather than on the averaged ERP waveform (or the grand average).

Reason 6: Peak amplitude is strongly impacted by trial-to-trial latency variability, but mean amplitude is completely insensitive.  If the single-trial amplitude of a component is the same in two groups or conditions, but there is more latency variability in one group/condition than in the other, the peak amplitude in the averaged ERP waveform will be lower in the group/condition with greater latency variability. For example, it may appear that a patient group has a lower amplitude than a control group if the patient group has more variability in the timing of their brain activity.  However, mean amplitude is completely unaffected by latency variability (assuming the measurement window is wide enough), so a difference in latency variability cannot artificially produce a difference in mean amplitude. If you see a difference between a patient group and a control group in mean amplitude (with a sufficiently broad measurement window), you know it reflects a bona fide difference in the single-trial amplitudes.

A caveat: Choosing the time window.  The biggest challenge in using mean amplitude is deciding on the measurement window. If you use the observed data to choose the time window, you can dramatically increase the possibility that noise in the data leads to a statistically significant (but completely bogus and unreplicable) effect.  We will discuss solutions to this problem in a future blog post. In the meantime, see this article: Luck, S. J., & Gaspelin, N. (2017). How to Get Statistically Significant Effects in Any ERP Experiment (and Why You Shouldn’t). Psychophysiology, 54, 146-157.

ERP Boot Camp Tip: Comparing conditions with different numbers of trials

A common question in ERP research is whether it is legitimate to compare conditions in which different numbers of trials were averaged together (e.g., error trials versus correct trials in an ERN study; oddballs versus standards in an oddball or MMN study).  It turns out that the answer depends on how you're measuring the ERP components.  In a nutshell: if you're measuring mean amplitude, then it's not a problem to compare conditions with different numbers of trials; if you are measuring peak amplitude, then it is a problem.

An extended discussion of this issue can be found in this document. Here, we provide a brief summary.

The figure below shows a clean ERP waveform and the same ERP waveform with noise added. Note that the peak amplitude is higher in the noisy waveform.  This exemplifies a general principle: All else being equal, the peak voltage will be greater in a noisier waveform than in a cleaner waveform.  This is why it is not legitimate to compare waveforms with different numbers of trials (and therefore different noise levels) when using peak amplitude.  The usual solution to this problem is to create an averaged ERP waveform using a subsample of trials from the condition with more trials, equating the number of trials in the averages.  However, it is almost always better to stop using peak amplitude and instead use mean amplitude to quantify the amplitude of the component (see Chapter 9 in An Introduction to the Event-Related Potential Technique for a list of reasons why mean amplitude is almost always superior to peak amplitude).

different numbers of trials.jpg

Mean amplitude (e.g., the average voltage between 300 and 500 ms) is not biased by the noise level.  That is, the mean amplitude will be more variable if the data are noisier, but it is not consistently pushed toward a larger value.  So, you might have more subject-to-subject variability in a condition with fewer trials, but most statistical techniques are robust to modest differences in variance, and this variability will not induce an artificial difference in means between your groups.  There is no need to subsample from the condition with more trials when you are using mean amplitude.  You are just throwing away statistical power if you do this.

Bottom line: In almost every case, the best way to deal with the "problem" of different numbers of trials per condition is to do nothing at all, except make sure you're using mean amplitude to quantify the amplitude.

Hints for ICA-based artifact correction

ICA is a great tool for correcting artifacts, especially eye blinks. Here we provide some practical hints for ICA-based artifact correction.

One of the most difficult parts for new users is knowing which independent components (ICs) reflect artifacts and should be removed.  There's a really great overview here, which describes how to use the combination of scalp distribution, time course, and frequency content to distinguish among artifacts.

A fundamental assumption of ICA is that the artifact has a perfectly consistent scalp distribution.  This is true for some artifacts, such as blinks and EKG, but it may not be true for others (e.g., EMG, eye movements).  ICA works reasonably well with EMG and eye movements under some conditions (especially if all the eye movements are along a single plane), but we recommend caution with these artifacts.

A key aspect of ICA is that the number of ICs must necessarily be equal to the number of channels. You obviously aren't changing the number of underlying brain components by changing the number of electrodes, so the fact that the number of ICs changes as you vary the number of electrodes should make it clear that ICA is an imperfect approach that will not work for every kind of artifact.  Also, no matter how many electrodes you have, the number of brain components is likely to be greater than the number of ICs.  So, ICA will inevitably blend multiple brain components into a single IC, and a single brain component may be split across multiple ICs. As a result, ICA cannot be expected to figure out all the true underlying components.  In practice, ICA works best for components that are relatively large and relatively common.  For this reason, our labs mainly use ICA for blinks, which are both very large (in all participants) and fairly common (in most participants). 

Given that the number of ICs is fixed, you don't want to "waste" ICs on huge but infrequent artifacts (especially if you have a relatively small number of channels).  For example, your participants may have periods of "crazy" EEG during breaks (as a result of stretching, movement, etc.), and these periods may eat up a lot of ICs.  You may therefore want to delete sections of "crazy data" before performing ICA.  ERPLAB Toolbox has two routines that are designed to help with this.  One can automatically delete periods of data between trial blocks.  Another can detect and delete periods of crazy data.  But don't use this approach to delete ordinary artifacts -- this should be for periods in which you are seeing huge and irregular voltage deflections.

Similarly, it's important to eliminate slow drifts prior to ICA.  We generally recommend a high-pass filter with a half-amplitude cutoff of 0.1 Hz and a slope of 12 dB/octave.  You can also apply a low-pass filter if your data have a lot of high-frequency noise.  This filtering should be done on the continuous data (prior to epoching and prior to deleting segments of crazy data) and should be consistent for all participants (e.g., don't low-pass filter for some participants but not others, or use different cutoffs for different participants). In theory, you can calculate the ICA weights on heavily filtered data (e.g., high-pass cutoff at 1 Hz) and then apply the weights to less filtered data, but this is not guaranteed to work well.

Another important bit of practical advice is that ICA involves training a neural network, and you need enough "trials" (time points) to train the network. A general heuristic is that the # of time points must be greater than 20 x (# channels)^2.  The key is that the number of channels is squared.  So, with 64 channels, you would need 81,920 points (which would be about 5.5 minutes of data with a 250 Hz sampling rate).  However, with 128 channels, you would need 4 times as many points, and with 256 channels, you would need 16 times as many points.

For additional, very specific advice, see Makoto's preprocessing pipeline.

ERP Boot Camp Tip: General Hints for Processing Data

EEG/ERP data are noisy and complicated, and it's easy to make mistakes or miss problems. Here are some hints for avoiding common problems that arise in EEG/ERP data collection and processing.

Start by running one subject and then doing a fairly complete analysis of that subject's data.  You will likely find some kind of problem (e.g., a problem with the event codes) that you need to fix before you run any more subjects.  Make sure you check the number of trials in each condition to make sure that it exactly matches what you expect.  Also, make sure you check the behavioral data, and not just the ERPs.  If you collect data from multiple subjects before doing a complete analysis, there's about a 50% chance that you will find a problem that requires that you throw out all of the data that you've collected, which will make you very sad. Do not skip this step! 

Once you verify that everything in your task, data collection procedures, and analysis scripts is working correctly, you can start collecting data from multiple additional subjects.  However, you should do a preliminary analysis of each subject's data within 48 hours of collecting the data (i.e., up to and including the point of plotting the averaged ERP waveforms).  This allows you to detect a problem (e.g., a malfunctioning electrode) before you collect data from a bunch of subjects with the same problem. This is especially important if you are not the one collecting the data and are therefore not present to notice problems during the actual recording session. 

The first time you process the data from a given subject, don't do it with a script!  Instead, process the data "by hand" (using a GUI) so that you can make sure that everything is OK with the subject's data.  There are many things that can go wrong, and this is your chance to find problems.  The most important things to look at are: the raw EEG before any processing, the EEG data after artifact detection, the time course and scalp distribution of any ICA components being excluded, the number of trials rejected in each condition, and the averaged ERP waveforms.  We recommend that you set artifact rejection parameters individually for each subject, because different people can have very different artifacts.  One size does not fit all.  (In a between-subjects design, the person setting the parameters should be blind to group membership to avoid biasing the results.)  These parameters can then be saved in an Excel file for future use and for reporting in journal articles.

If you need to re-analyze your data (e.g., with a different epoch length), it's much faster to do this with a script.  Your script can read in any subject-specific parameters from the Excel file.  Also, it's easy to make a mistake when you do the initial analysis "by hand," so re-analyzing everyone with a script prior to statistical analysis is a good idea. However, it is easy to make mistakes in scripting as well, so it's important to check the results of every step of processing in your script for accuracy.  It can also be helpful, especially if you are new to scripting, to have another researcher look through your data processing procedures to check for accuracy. 

Bottom line: Scripts are extremely useful for reanalyzing data, but they should not be used for the initial analysis.  Also, don't just borrow someone else's script and apply it to your data.  If you don't fully understand every step of a script (including the rationale for the parameters), don't use the script.

Hints for Processing Data.jpg

ERP Boot Camp Tip: What does the polarity of an ERP component mean?

We are often asked whether it means something whether a component is positive (e.g., P2 and P3) or negative (e.g., N1, N400, error-related negativity).  The answer, for the most part, is "no".

First, every ERP component will be positive on one side of the head and negative on the other side.  We often don't "see" the other side of a component (e.g., the negative side of the P3) because (a) the opposite-polarity side is in a place without any electrodes (e.g., the bottom of the skull), (b) the opposite-polarity side is obscured by other components, or (c) the opposite-polarity side is spatially diffuse (low amplitude and broadly distributed).  But it's there!

As the figure below shows, there are 4 factors that determine the polarity of an ERP component.  If we knew 3, we could in principle determine the 4th by knowing the polarity.  In practice, we never know 3 so we cannot determine the 4th.  In particular, although the polarity depends on whether the ERP arises from excitatory or inhibitory neurotransmission, we cannot ordinarily determine whether a component represents excitation or inhibition from its polarity.

Polarity.jpg

Mainly, polarity is used to help identify a given component.  For example, if our active electrodes are near Pz and our reference electrodes are near the mastoids, we can be sure that the P3 will be a positive voltage.  Beyond that, polarity doesn't tell us much.

ERP Boot Camp Tip: Stimulus Duration

Here's a really simple tip regarding the duration of visual stimuli in ERP experiments: In most cases, the duration of a visual stimulus should be either (a) between 100 and 200 ms or (b) longer than the time period that you will be showing in your ERP waveforms.  

timing.jpg

Here's the rationale: If your stimulus is shorter than ~100 ms, it is effectively the same as a 100 ms stimulus with lower contrast (look into Bloch's Law if you're interested in the reason for this).  For example, if you present a stimulus for 1 ms, the visual system will see this as being essentially identical to a very dim 100-ms stimulus.  As a result, there is usually no point is presenting a visual stimulus for less than 100 ms (unless you are using masking).

Once a stimulus duration exceeds ~100 ms, it produces an offset response as well as an onset response.  For example, the image shown here illustrates what happens with a 500-ms stimulus duration: There is a positive bump at 600 ms that is the P1 elicited by the offset of the stimulus.  This isn't necessarily a problem, but it makes your waveforms look weird.  You don't want to waste words explaining this in a paper.  So, if you need a long duration, make it long enough that the offset response is after the end of the time period you'll be showing in your waveforms.

The offset response gets gradually larger as the duration exceeds 100 ms.  With a 200-ms duration, the offset response is negligible.  So, if you want to give your participants a little extra time for perceiving the stimulus (but you don't want a very long duration), 200 ms is fine.  We usually use 200 ms in our schizophrenia studies.

Also, if the stimulus is <=200 ms, there is not much opportunity for eye movements (unless the stimulus is lateralized).  If you present a complex stimulus for >200 ms, you will likely get eye movements.  This may or may not be a significant problem, depending on the nature of your study.

Timing/phase distortions produced by filters

Yael, D., Vecht, J. J., & Bar-Gad, I. (2018). Filter Based Phase Shifts Distort Neuronal Timing Information. eNeuro 11 April 2018, ENEURO.0261-17.2018; DOI: 10.1523/ENEURO.0261-17.2018

This new paper describes how filters can distort the timing/phase of neurophysiological signals, including LFPs, ECoG, MEG, and EEG/ERPs.

See also the following papers (written with boot camp alumns Darren Tanner and Kara Morgan-Short), which show how improper filtering can create artificial effects (e.g., making a P600 look like an N400).

Tanner, D., Morgan-Short, K., & Luck, S. J. (2015). How inappropriate high-pass filters can produce artifactual effects and incorrect conclusions in ERP studies of language and cognition. Psychophysiology, 52, 997-1009.

Tanner, D., Norton, J. J., Morgan-Short, K., & Luck, S. J. (2016). On high-pass filter artifacts (they’re real) and baseline correction (it's a good idea) in ERP/ERMF analysis. Journal of Neuroscience Methods, 266, 166–170.

Bottom line: Filters are a form of controlled distortion that must be used carefully.  The more heavily you filter, the more you are distorting the temporal information in your signal.

How Many Trials Should You Include in Your ERP Experiment?

Boudewyn, M. A., Luck, S. J., Farrens, J. L., & Kappenman, E. S. (in press). How many trials does it take to get a significant ERP effect? It depends. Psychophysiology.

One question we often get asked at ERP Boot Camps is how many trials should be included in an experiment to obtain a stable and reliable version of a given ERP component. It turns out there is no single answer to this question that can be applied across all ERP studies. 

In a recent paper published in Psychophysiology in collaboration with Megan Boudewyn, a project scientist at UC Davis, we demonstrated how the number of trials, the number of participants, and the magnitude of the effect interact to influence statistical power (i.e., the probability of obtaining p<.05). One key finding was that doubling the number of trials recommended by previous studies led to more than a doubling of statistical power under many conditions. Interestingly, increasing the number of trials had a bigger effect on statistical power for within-participants comparisons than for between-group analyses. 

The results of this study show that a number of factors need to be considered in determining the number of trials needed in a given ERP experiment, and that there is no magic number of trials that can yield high statistical power across studies.