
A New Metric for Quantifying ERP Data Quality
/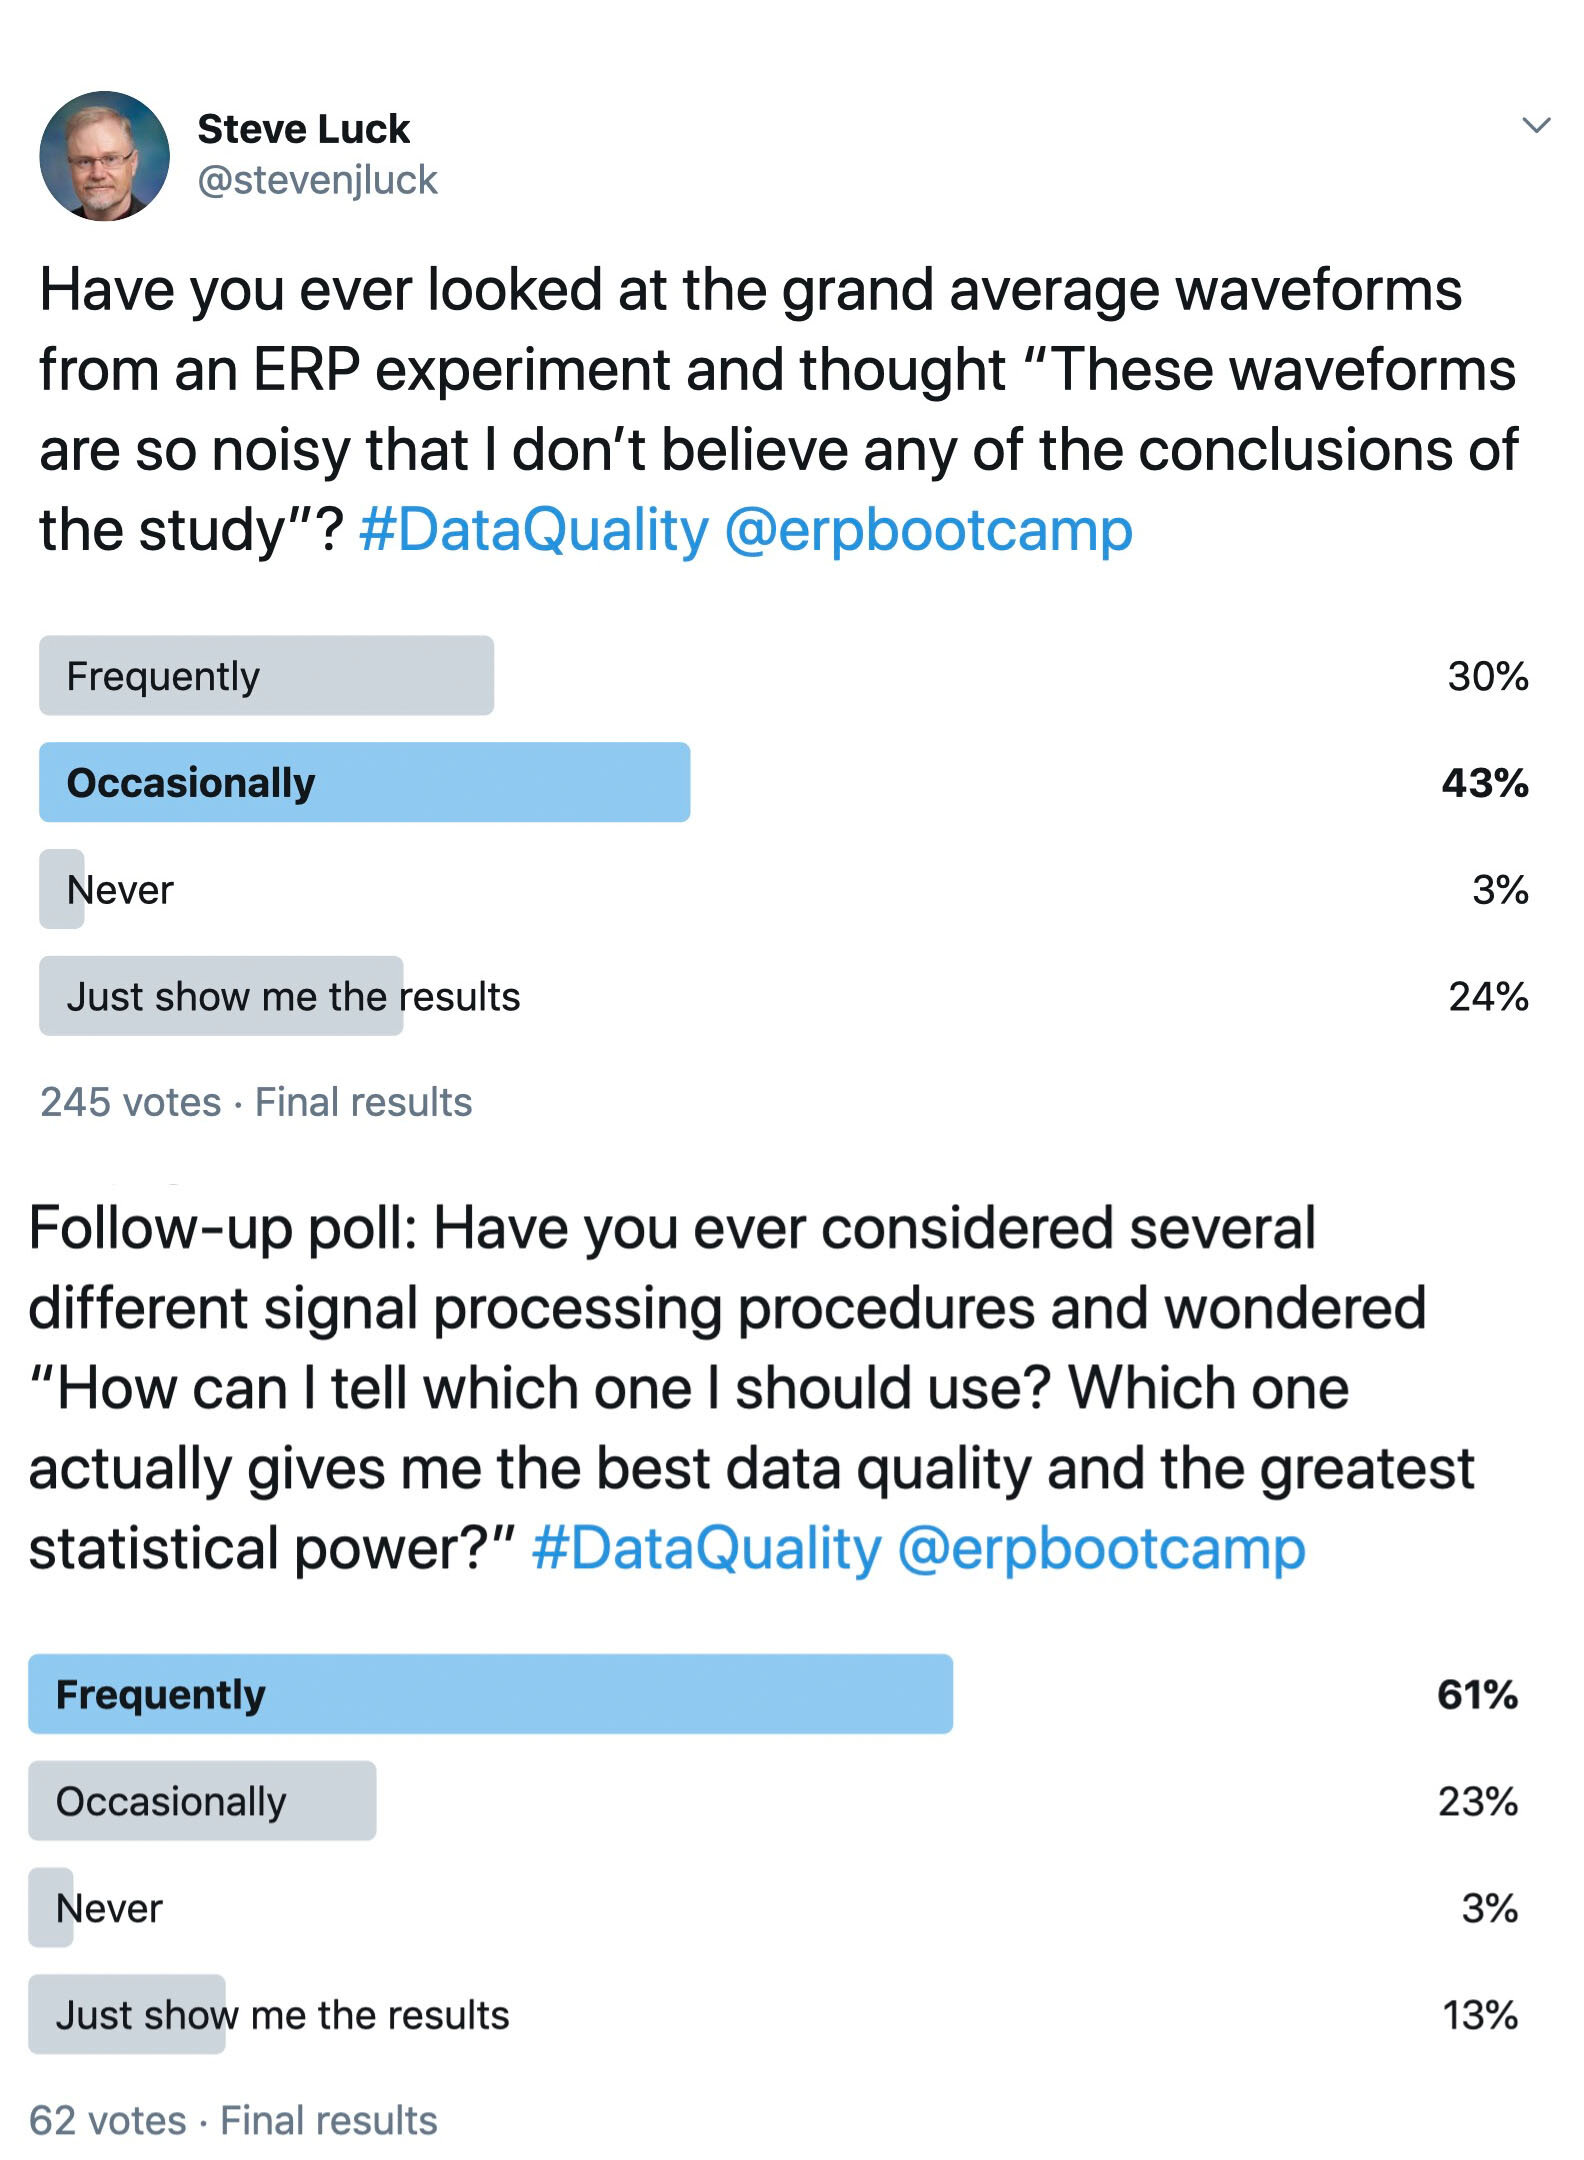
I’ve been doing ERP research for over 30 years, and for that entire time I have been looking for a metric of data quality. I’d like to be able to quantify the noise in my data in a variety of different paradigms, and I’d like to be able to determine exactly how a given signal processing operation (e.g., filtering) changes the signal-to-noise ratio of my data. And when I review a manuscript with really noisy-looking data, making me distrust the conclusions of the study, I’d like to be able to make an objective judgment rather than a subjective judgment. Given the results of the Twitter polls shown here, a lot of other people would also like to have a good metric of data quality.
I’ve looked around for such a metric for many years, but I never found one. So a few years ago, I decided that I should try to create one. I enlisted the aid of Andrew Stewart, Aaron Simmons, and Mijke Rhemtulla, and together we’ve developed a very simple but powerful and flexible metric of data quality that we call the Standardized Measurement Error or SME. If you’re in a hurry, click here for a 3-minute video overview.
The SME has 3 key properties:
It reflects the extent to which noise (i.e., trial-to-trial variations in the EEG recording) impacts the score that you are actually using as the dependent variable in your study (e.g., the peak latency of the P3 wave). This is important, because the effect of noise will differ across different amplitude and latency measures. For example, high-frequency noise will have a big impact on the peak amplitude between 300 and 500 ms but relatively little impact on the mean voltage during this time range. The impact of noise depends on both the nature of the noise and what you are trying to measure.
It quantifies the data quality for each individual participant at each electrode site of interest, making it possible to determine (for example) whether a given participant’s data are so noisy that the participant should be excluded from the statistical analyses or whether a given electrode should be interpolated.
It can be aggregated across participants in a way that allows you to estimate the impact of the noise on your effect sizes and statistical power and to estimate how your effect sizes and power would change if you increased or decreased the number of trials per participant.
The SME is a very simple metric: It’s just the standard error of measurement of the score of interest (e.g., the standard error of measurement for the peak latency value between 300 and 500 ms). It is designed to answer the question: If I repeated this experiment over and over again in the same participant (assuming no learning, fatigue, etc.), and I obtained the score of interest in each repetition, how similar would the scores be across repetitions? For example, if you repeated an experiment 10,000 times in a given participant, and you measured P3 peak latency for each of the 10,000 repetitions, you could quantify the consistency of the P3 peak latency scores by computing the standard deviation (SD) of the 10,000 scores. The SME metric provides a way of estimating this SD using the data you obtained in a single experiment with this participant.
The SME can be estimated for any ERP amplitude or latency score that is obtained from an averaged ERP waveform. If you quantify amplitude as the mean voltage across some time window (e.g., 300-500 ms for the P3 wave), the SME is trivial to estimate. If you want to quantify peak amplitude or peak latency, you can still use the SME, but it requires a somewhat more complicated estimation technique called bootstrapping. Bootstrapping is incredibly flexible, and it allows you to estimate the SME for very complex scores, such as the onset latency of the N2pc component in a contralateral-minus-ipsilateral difference wave.
Should you start using the SME to quantify data quality in your own research? Yes!!! Here are some things you could do if you had SME values:
Determine whether your data quality has increased or decreased when you modify a data analysis step or experimental design feature
Notice technical problems that are reducing your data quality (e.g., degraded electrodes, a poorly trained research assistant)
Determine whether a given participant’s data are too noisy to be included in the analyses or whether a channel is so noisy that it should be replaced with interpolated values
Compare different EEG recording systems, different recording procedures, and different analysis pipelines to see which one yields the best data quality
The SME would be even more valuable if researchers started regularly including SME values in their publications. This would allow readers/reviewers to objectively assess whether the results are beautifully clean, unacceptably noisy, or somewhere in between. Also, if every ERP paper reported the SME, we could easily compare data quality across studies, and the field could determine which recording and analysis procedures produce the cleanest data. This would ultimately increase the number of true, replicable findings and decrease the number of false, unreplicable findings.
My dream is that, 10 years from now, every new ERP manuscript I review and every new ERP paper I read will contain SME values (or perhaps some newer, better measure of data quality that someone else will be inspired to develop).
To help make that dream come true, we’re doing everything we can to make it easy for people to compute SME values. We’ve just released a new version of ERPLAB Toolbox (v8.0) that will automatically compute the SME using default time windows every time you make an averaged ERP waveform. These SME values will be most appropriate when you are scoring the amplitude of an ERP component as the mean voltage during some time window (e.g., 300-500 ms for the P3 wave), but they also give you an overall sense of your data quality. If you are using some other method to score your amplitudes or latencies (e.g., peak latency), you will need to write a simple Matlab script that uses bootstrapping to estimate the SME. However, we have provided several example scripts, and anyone who knows at least a little bit about Matlab scripting should be able to adapt our scripts for their own data. And we hope to add an automated method for bootstrapping in future versions of ERPLAB.
By now, I’m sure you’ve decided you want to give it a try, and you’re wondering where you can get more information. Here are links to some useful resources:
Full-length paper about the SME
Luck, S. J., Stewart, A. X., Simmons, A. M., & Rhemtulla, M. (2021). Standardized measurement error: A universal metric of data quality for averaged event-related potentials. Psychophysiology, 58, e13793. https://doi.org/10.1111/psyp.13793 [Access free on National Library of Medicine]